Efficient Strategies: Managing Long Running Jobs in JDA/Blue Yonder with RedPrairie Consultants and Blue Yonder JDA Expert
By Saad Ahmad, Executive Vice President at Smart IS International
We often have jobs that perform long tasks. There is no easy way to see the work they are performing at a given time. The only option is to look at MOCA Console or another similar view which provides a low level window into the MOCA command or SQL that is being executed. Historical information is not easy to view either.
While this solution describes it in the context of JDA/Blue Yonder — the concept is universal and can be used in any solution where long running operations are implemented.
Our Solution
At Smart IS we have developed a universal approach to handle this problem which we apply in all of our solutions including JDA/Blue Yonder jobs. We view any long-running operation as follows:
- Each instance of execution is a job
- The job executes one or more modules
- The module executes one or more actions
- Start and stop of job, module, and action is recorded with timestamp in a separate commit context so that it is visible outside the transaction right way.
- In case of an error the error information is recorded as well.
- All of this information is kept in a database table so it can be referenced later
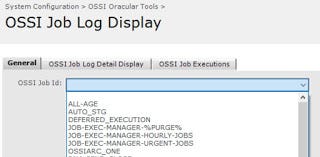
- DDAs are available so that end users can view this information.
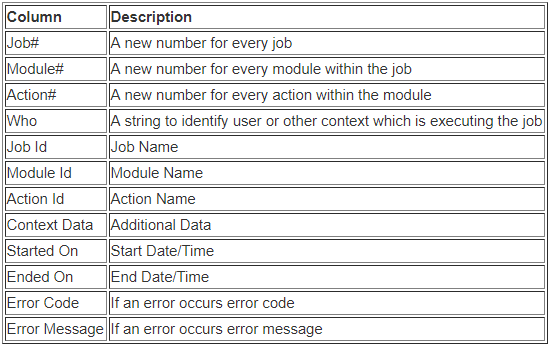
A table called usr_ossi_job_log records this information. It has the following structure:

So, as a job progresses it keeps updating this table in a separate commit context. This allows the users to know exactly how far along this instance of the job is and given that we have historical data we can reasonably predict when the job will end.
Making It Happen!
Tomake it all come together we have created a set of MOCA commands and functions that allow our code to be simple while providing information to this table at the same time. A typical job will be structured as follows:
/*
* Adds a row to the table with new job#, job-id, additional information,
* and who information. The start date/time is logged as well. module
* and action are set to % (literal). Commits this data in a separate
* commit context
*/
publish data
where uc_ossi_job_seq = ossi__register_job ( 'JOB-ID, 'SOME-INFO',     'WHO-INFO' )
|
try
{
/*
* Some step(s) during the job
* Adds row to the table for the job#. gets a new module# and
* returns that. Row has module name and also additional
* information as needed. Additional. Action is set to
* % (literal). Additional Information can come in handy
* to for example to log when we are processing several
* rows of a domain, like processing orders in a wave.
* You could log something like 1/n there so that you can see
* how far along the job is. This is committed in a separate
* commit context.
*/
publish data
where uc_ossi_module_seq = ossi__register_module ( @uc_ossi_job_seq, 'MODULE NAME', 'MORE DATA' )
|
try
{
/*
* This module will have 1 or more actions - each coded like
* We do not have to use action concept - this becomes useful
* if we can divide a module further. For example module could
* be an order and action could be pick. Idea is same as module
* - here we can give action name and additional information
* Additional Information can be used to provide specific
* details and also 1/n type of data. This is committed in a
* separate commit context.
*/
publish data
where uc_ossi_action_seq = ossi__register_action (
@uc_ossi_job_seq, @uc_ossi_module_seq,
'ACTION NAME', 'MORE DATA' )
|
try
{
moca comamnds that do the work
}
finally
{
/*
* uc_ossi_job_seq, uc_ossi_module_seq. uc_ossi_action_seq are in scope * so that row
* is updated with timestamp and error information.
* This is committed in a separate commit context.
*/
complete ossi job log
where uc_ossi_err_code = @?
and uc_ossi_err_descr = @!
}
}
finally
{
/*
* uc_ossi_job_seq and uc_ossi_module_seq are in scope so that row
* is updated with timestamp and error information.
* This is committed in a separate commit context.
*/
complete ossi job log
where uc_ossi_err_code = @?
and uc_ossi_err_descr = @!
 }
}
finally
{
/*
* Updates the row in the table for the job itself (added in
* register of job). Sets end time and also error
* information if applicable.
* This is committed in a separate commit context.
*/
complete ossi job
where uc_ossi_err_code = @?
and uc_ossi_err_descr = @!
}
As this job progresses through several actions we will be publishing the progress of the job to this table — so we will know exactly how far along it is. We will also know historically how long the job has taken and how long the various modules and actions have taken.
The data structure is generic and will work for any long running operation.
End User View
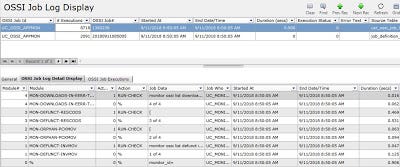
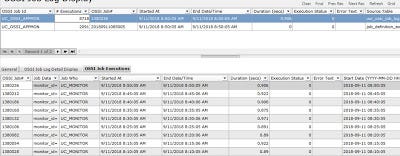
The users can view all of the jobs in a simple to use front-end.


Conclusion: RedPrairie Consultants and Blue Yonder JDA Expert
The user can view all of the jobs using this approach. The data provided by this approach is extremely valuable for support. We can detect if a job is stuck and monitor the progress of long-running operations. We can easily predict when the job will end and can objectively determine if the performance has deteriorated. In the case of performance, we can pinpoint the exact operation that is the culprit.
Originally published at saadwmsblog.blogspot.com.


